

Business Dashboard Development - Business Dashboards
You Can Act On
We build real-time analytics dashboards that give you full visibility into your KPIs, metrics, and team performance pulling from every data source in one place. Stop guessing. Start deciding.
End-to-End Business Dashboard Services
From real-time KPI tracking to multi-source data merging & interactive charts — we build custom dashboards that drive actions.
Real-time KPI Dashboards
Live dashboards that pull data from your CRM, database, ad platforms, and tools — displaying your most critical KPIs in one place, updated automatically.
Interactive Charts & Graphs
Drill-down charts, trend lines, heatmaps, and pivot tables — interactive visualisations that let your team explore data without touching a spreadsheet.
Multi-source Data Integration
Connect and merge data from your CRM, database, Google Sheets, ad platforms, payment gateways, and any API — unified into a single dashboard view.
Automated Alerts & Reports
Set threshold-based alerts that notify your team via Slack or email the moment a KPI drops or spikes — plus scheduled PDF or email reports sent automatically.
Scheduled Data Refresh
Data refreshes automatically on your chosen schedule — hourly, daily, or in real time — so your team always works with accurate, up-to-date numbers.
Role-based Access Control
Different teams see different data. Set granular permissions so executives see company-wide metrics, while individual teams see only their own performance.
Full Visibility. Zero Guesswork.
Real-time dashboards unify your data sources into a single source of truth — giving leadership and teams the metrics they need to act fast.
10+ scattered spreadsheets, manual weekly report assembly, outdated metrics & delayed decisions.
Single live KPI view, 10+ data sources merged, automated alerts & real-time decision making.
Dashboard specialists since 2019
Grafana, Metabase & custom-build experts
250+ automation systems delivered globally
Dedicated project manager per engagement
Clean, documented, production-ready builds
NDA & full IP ownership guaranteed
Long-term support & maintenance plans
Free 30-day post-launch support included
Industries We Serve
Custom analytics dashboards tailored to the operational demands of high-growth global sectors.
E-commerce
Sales & Inventory View
Healthcare
Patient & Ops Metrics
B2B / SaaS
ARR, MRR & Churn Analytics
Finance
Revenue & Expense Control
Logistics
Fleet & Delivery Tracking
Agencies
Multi-client KPI Portals
Dashboards We Build
From sales performance to executive summaries, we build interactive real-time dashboards for every department.
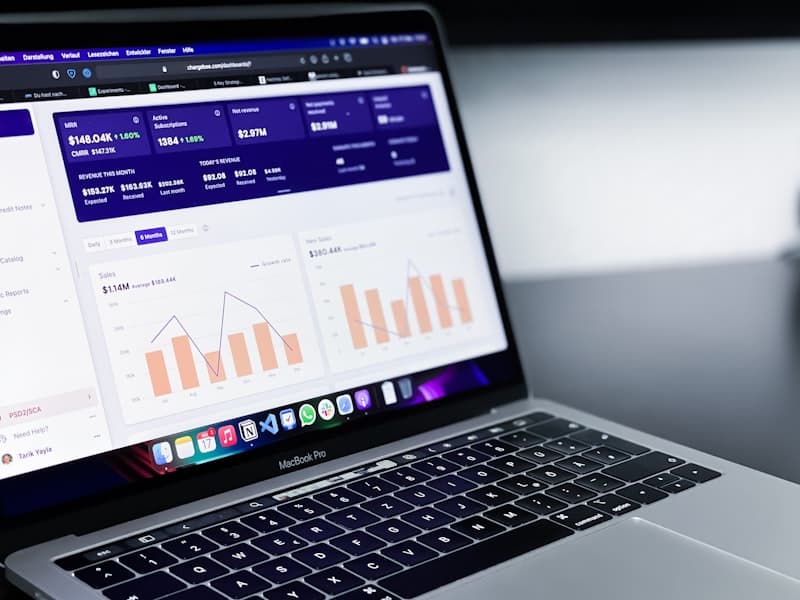
Sales Performance Dashboard
Track revenue, pipeline value, deals closed, rep performance, and conversion rates — all in real time, pulled directly from your CRM.
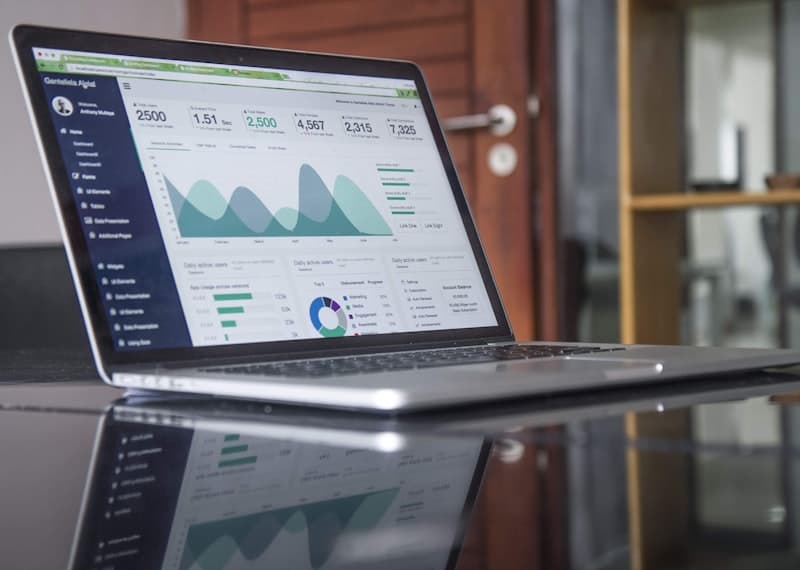
Marketing Analytics Dashboard
Unify Google Ads, Meta Ads, SEO, and email metrics into one view — see ROAS, CPL, and channel attribution without switching between 5 different tools.
Operations & Logistics Dashboard
Monitor order fulfilment rates, delivery timelines, inventory levels, and SLA breaches in real time — with instant alerts when thresholds are crossed.

Finance & Revenue Dashboard
Track MRR, ARR, churn, cash flow, and expense breakdowns — with forecasts and trend lines that update automatically as new data comes in.

Customer Success Dashboard
Monitor NPS scores, support ticket volumes, resolution times, churn signals, and account health scores — giving your CS team full visibility.
Executive Summary Dashboard
One screen with every business-critical metric — revenue, growth, team performance, and operational health — refreshed daily and shared with leadership automatically.
Dashboard Tech Stack
Industry-leading BI frameworks, databases, and native APIs for secure, scalable dashboards.
 Grafana
 Metabase
 Supabase
 PostgreSQL
 n8n
n8n Google Sheets
 HubSpot
 Airtable
 REST APIs
From Audit to Live Dashboard
Data Audit
Identify data sources, audit quality & map each KPI to its source.
Dashboard Design
Wireframe dashboard views, layouts & chart types for your approval.
Build & Connect
Build dashboard, connect data sources, set refresh rates & configure alerts.
Deploy & Train
Deploy live, configure access controls & train your team on drill-downs.
Advanced Dashboard Features
Our dashboards go far beyond basic charts — they feature AI forecasting, deep drill-downs, and TV/mobile optimization.
AI-powered Forecasting
Embed predictive models that forecast revenue, churn, and demand — displayed directly in your dashboard alongside real-time actuals.
Drill-down & Filtering
Click any chart segment to drill into the underlying data — filter by date, region, rep, or product and explore without any SQL knowledge.
TV & Mobile Ready
Dashboards built to display on office TV screens, executive laptops, and mobile devices — responsive and optimised for every screen size.
Scheduled PDF Reports
Auto-generate and email PDF or CSV snapshots of any dashboard view — daily, weekly, or monthly — directly to your stakeholders.
FAQ
Common Business Dashboard Development Questions
Have more questions? Book a free 30-minute discovery call no commitment required.
Book a free callWhat data sources can you connect?
We connect any source with an API or database — including HubSpot, Salesforce, Stripe, Shopify, Google Analytics, Google Ads, Meta Ads, Airtable, PostgreSQL, MySQL, Google Sheets, and more. If it has data, we can visualise it.
How often does the data refresh?
We configure refresh intervals based on your needs — from true real-time (via webhooks) to hourly, daily, or custom schedules. Each data source can have its own refresh rate.
Can different team members see different data?
Yes. We build role-based access control so each user or team sees only the data relevant to them — executives get the full picture, reps see their own performance.
Will we be able to modify the dashboard ourselves after delivery?
Yes. We build on platforms like Grafana and Metabase that allow non-technical users to add charts, change metrics, and modify filters. We deliver full training and documentation.


Let's Build Your Business Dashboard
Tell us about your data sources and KPIs and we'll provide a detailed dashboard proposal within 24 hours.